
BORN TO LEAD?
Testing the relative age effect at the top of the FTSE 100 and Fortune 100

The bottom line, up front
In youth sport, in primary school, and in elite hockey academies, the relative age effect is real and often striking — children born just after a school-year cutoff are bigger, older, and more confident than their classmates, and that small advantage compounds. Books like Outliers have made the idea famous. The natural next question: does that compounding advantage stretch all the way to the corner office?
We collected verified birth months for the chief executives of the FTSE 100 and Fortune 100, mapped each CEO to the academic-year cutoff of the country in which they were educated, and tested whether the oldest third of each cohort is over-represented at the top.
The short answer: no. Across 163 CEOs from 24 different education systems, 29.4% were born in the oldest third of the academic year — almost exactly the 33.3% you would expect by chance, and statistically indistinguishable from it. The pattern holds when we split FTSE from Fortune, when we restrict to UK-educated executives, when we restrict to US-educated executives, and when we use the strictest test of comparing the oldest three months to the youngest three. There is no evidence in this dataset that being born early in the school year improves your odds of running a blue-chip company.
Whatever advantage the eldest pupils carry into the playground appears to have washed out by the time anyone is being short-listed to lead a multi-billion-pound enterprise.
What we measured, and why
The relative age effect (RAE) is the observation that, within a single school cohort, children born just after the year’s admission cutoff have an 11-month head start on the youngest in the room. They are taller, more verbal, and more emotionally regulated than classmates who are functionally a year younger. Teachers select them more often for leadership roles, sports coaches pick them for first teams, and self-belief snowballs. By age 18 the head start has become a track record.
Whether that track record actually carries into adult outcomes is a more contested question. The most cited paper in the area — Du, Gao and Levi’s 2012 study of 375 S&P 500 CEOs — found that summer-born executives (the youngest in the US September cutoff) were under-represented and concluded that RAE shaped CEO selection. A 2024 follow-up by Pegah and Bigus, using a much larger S&P 1500 sample with more precise cutoff data, came to the opposite view: no effect. Our analysis is the first, to our knowledge, to apply the same lens simultaneously to the largest UK and US listed companies, with cutoff dates matched to each individual’s actual education country.
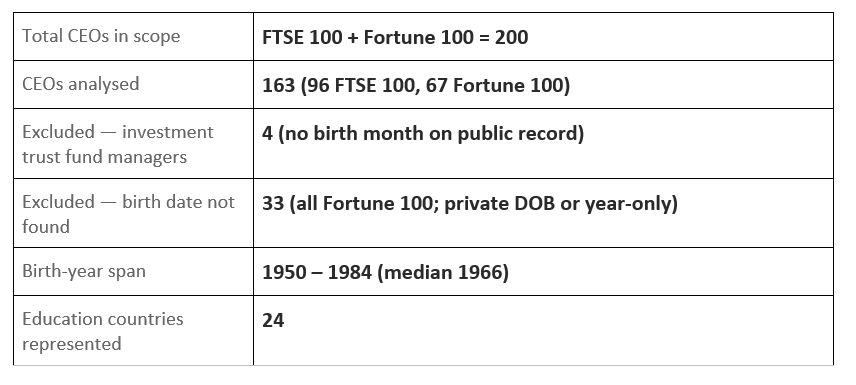
1. The dataset
We started with the constituents of the FTSE 100 and the Fortune 100 as currently listed and built a CEO-level dataset with verified date-of-birth information drawn primarily from Companies House, Wikipedia (cross-referenced where possible), corporate biographies, news coverage, and SEC filings. For each CEO we recorded:
• Birth month (the level of precision required for relative-age analysis)
• Birth year
• Country of education — defined as where they completed primary and secondary schooling, the formative period for cohort assignment
• Academic-year cutoff for that country
• Resulting tertile within the academic year (oldest, middle or youngest third)
Two practical points are worth highlighting before any results.
Missing data is concentrated in the Fortune 100. All 100 FTSE 100 CEOs have an identifiable birth month (UK Companies House requires director DOB filings, which makes this comparatively easy). For the Fortune 100, 33 CEOs are excluded because only the birth year — not the month — could be verified to a satisfactory standard. This is a real limitation: missingness is not random across the two lists, and we discuss its implications in the limitations section.
CEOs go to school where they grew up, not where they work. A FTSE 100 chief who attended secondary school in São Paulo is evaluated against the Brazilian academic year, not the UK’s. This is the single most important methodological choice in the analysis: the relative age effect, if it operates, operates in the country where you were a child, not the country where you became a CEO. Of FTSE 100 CEOs in our sample, only 48% were UK-educated; the rest span 17 other countries. Of Fortune 100 CEOs, 76% were US-educated.
2. Methodology
Mapping birth months to academic-year position
Each CEO’s birth month is converted into a position in their national academic year, where 1 = born immediately after the cutoff (the oldest in their school class) and 12 = born immediately before the next cutoff (the youngest). For example, a UK-educated CEO born in September is position 1; one born in August is position 12.
We then group the twelve positions into three tertiles of four months each: oldest, middle, and youngest. Under the null hypothesis that birth month does not influence CEO selection, each tertile should contain roughly one third of CEOs.
The tests
We applied four tests, each progressively narrower:
• Tertile chi-squared. Compares observed counts in oldest/middle/youngest thirds to the 1/3 expectation.
• Binomial on oldest tertile. Tests whether the oldest third is over-represented (the specific direction predicted by RAE).
• First three vs last three months. The classic relative-age test: is the oldest quarter of births larger than the youngest quarter? This isolates the months where the age gap to classmates is most extreme.
• Position-by-position chi-squared. Treats each of the twelve academic-year positions separately and tests for any deviation from a uniform 8.3% per slot.
All tests are two-sided. We also report 95% Wilson confidence intervals on the percentage of CEOs in the oldest tertile across multiple subgroups, which gives a clearer sense of statistical uncertainty than p-values alone.
3. The headline result
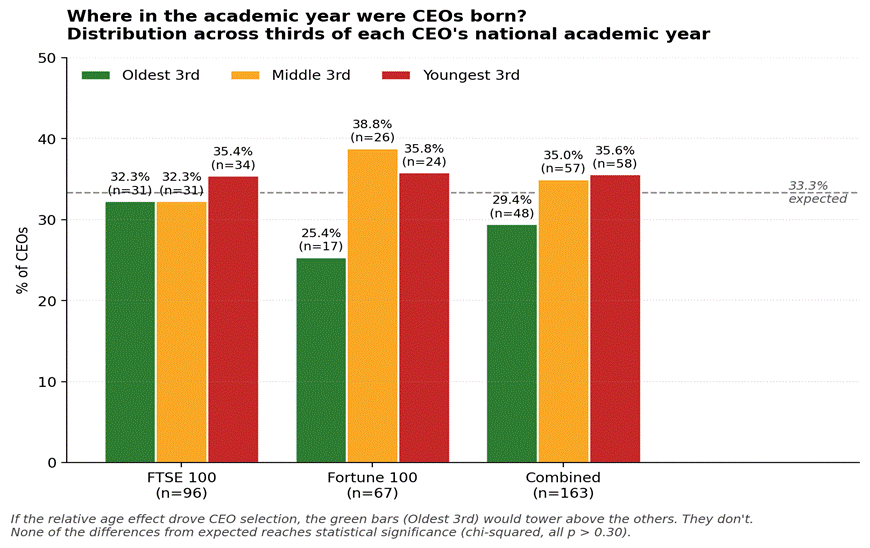
Fig 1. Across both indices, the oldest third of the academic year is not over-represented among CEOs. The Fortune 100 actually shows a slight under-representation of oldest-born executives, though the difference is well within sampling noise.
In the combined sample, 29.4% of CEOs were born in the oldest third of their cohort, against an expected 33.3%. The chi-squared statistic is 1.12 (df=2), giving a p-value of 0.57 — comfortably non-significant. The binomial test for over-representation of the oldest tertile yields p = 0.32. Splitting by index, the FTSE 100 distribution is essentially flat (32.3% / 32.3% / 35.4%) and the Fortune 100 actually leans the wrong way for RAE, with only 25.4% of CEOs in the oldest third — but again the sample is small enough that this is not statistically distinguishable from the 33.3% null.
Confidence intervals tell the same story
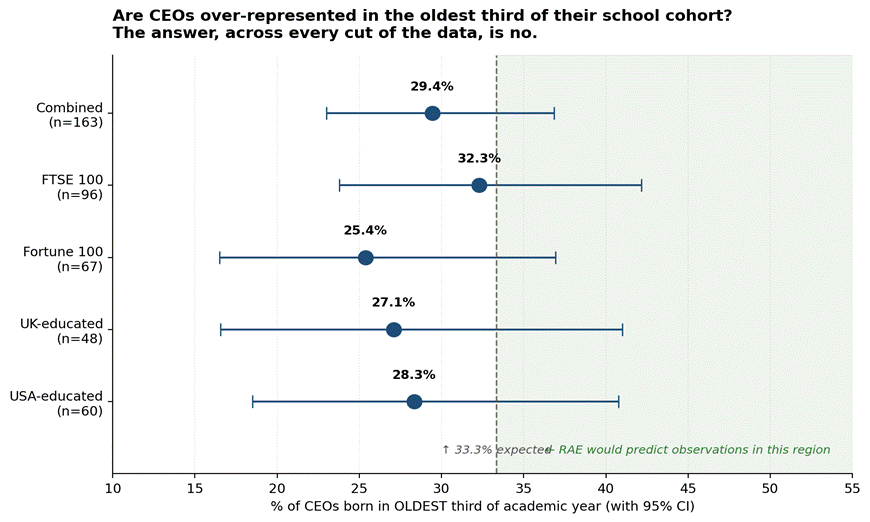
Fig 2. Every confidence interval crosses the 33.3% reference line. The point estimates cluster slightly below it. None lands meaningfully inside the green region where the relative age effect would predict observations to fall.
Plotting each subgroup’s point estimate alongside its 95% confidence interval makes the finding visually unambiguous: every interval comfortably crosses the 33.3% reference line. The pattern is not just statistically null — it is geometrically null. None of the dots is even on the “RAE predicts” side of the line.
The classic test: oldest 3 months vs youngest 3 months
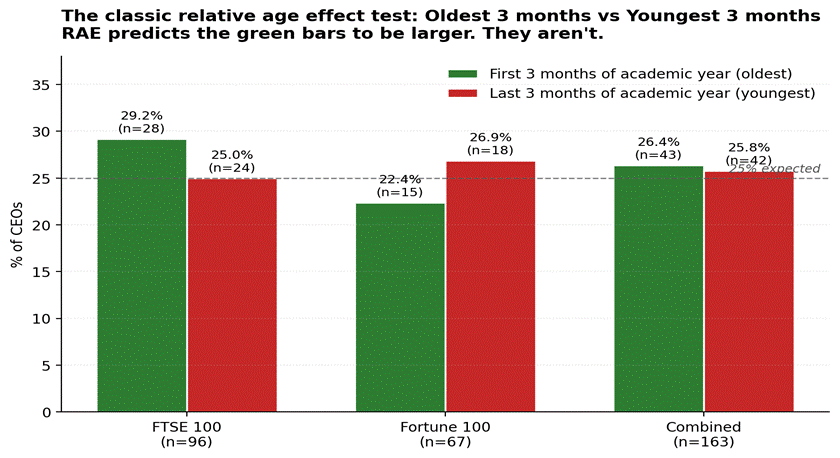
Fig 3. The most stringent RAE test compares the very oldest CEOs in their cohort (born in the first three months of the academic year) to the very youngest (last three months). RAE predicts the green bars to be visibly larger. They are not.
In the combined sample, 26.4% of CEOs (n=43) were born in the first three months of their academic year and 25.8% (n=42) in the last three. That is a difference of one CEO. If you had to pick a number that screamed “no effect,” it would be that one. The Fortune 100 alone actually has more CEOs in the youngest three months (26.9%) than the oldest (22.4%) — the opposite of the RAE prediction, though the gap of three CEOs out of 67 is well inside sampling noise.
4. Looking inside the academic year
Tertile-level results can hide finer patterns, so we also plotted the full twelve-position distribution for each index.
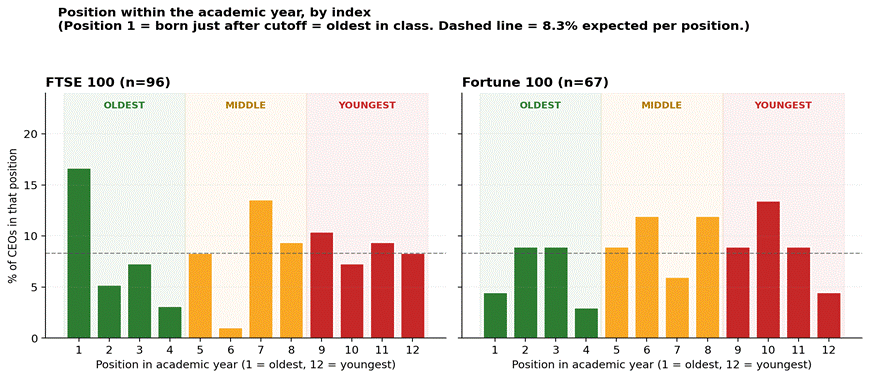
Fig 4. CEO births by position within the academic year, FTSE 100 and Fortune 100 separately. The dashed line marks the uniform 8.3% expectation per position.
A few features stand out, but each is more interesting than informative:
• Position 1 in the FTSE 100 (the very oldest in their cohort) does have a notable spike — 16 CEOs, or 16.7% of the index, against 8.3% expected. For UK-educated CEOs (the largest single block), position 1 is September. This sounds like an RAE result, but it is almost certainly population-level birth seasonality: September is one of the peak birth months in the UK’s general population for the cohorts in this dataset, particularly post-1976.
• Position 6 in the FTSE 100 has only 1 CEO. For most UK-educated CEOs this corresponds to February — a month with low underlying births in the UK. Again, baseline seasonality is the simpler explanation than any cohort-related selection mechanism.
• The Fortune 100 distribution is much flatter and shows no clear pattern, with chi-squared p = 0.58 against uniform.
In other words: where we do see deviations from uniformity, they look like reflections of the underlying birth seasonality of the population, not signatures of relative-age advantage flowing into the C-suite.
Calendar months: a seasonal echo, not an RAE signal
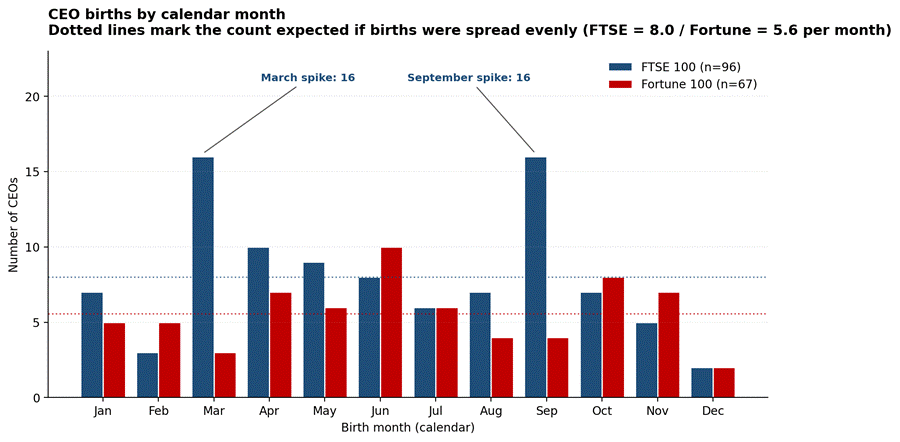
Fig 5. Calendar-month distribution of births. The two FTSE spikes (March, 16; September, 16) are conspicuous, but they align with known seasonal birth peaks in the UK rather than with RAE predictions.
Looked at by calendar month, the FTSE 100 distribution is in fact significantly non-uniform (chi-squared = 26.3, p = 0.006). However, this is a finding about UK demographic history, not about leadership selection. The peak in March-born CEOs reflects the spring birth maximum that dominated UK fertility patterns until around 1976; the peak in September-born CEOs reflects the autumn maximum that emerged afterwards. Both spikes occur in months that, for UK-educated children, fall in opposite tertiles of the academic year — March in the middle third, September in the oldest. They roughly cancel out at the tertile level.
The Fortune 100 calendar distribution shows no such pattern (p = 0.55) and no obvious seasonal spikes.
5. UK and US in detail
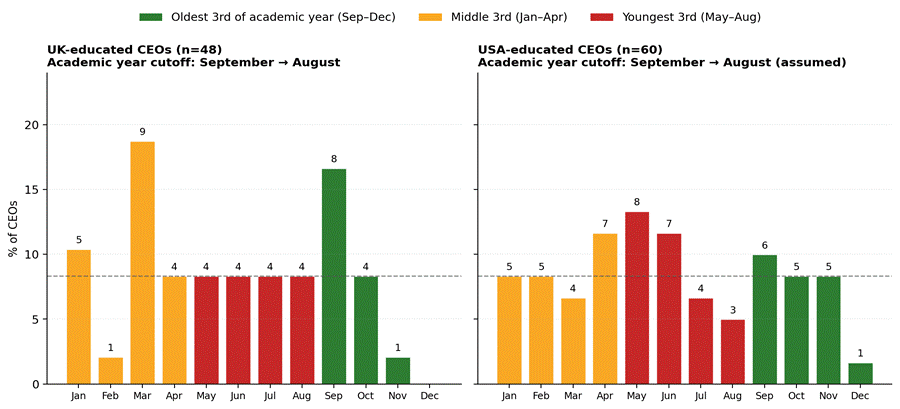
Fig 6. Within the two largest national subgroups, no clear RAE signal emerges. UK-educated CEOs show 27.1% in the oldest tertile (Sep–Dec) and 33.3% in the youngest (May–Aug). USA-educated CEOs show 28.3% / 36.7%.
Restricting to UK-educated CEOs (n=48) gives 27.1% in the oldest tertile, 39.6% in the middle, 33.3% in the youngest. For USA-educated CEOs (n=60), the figures are 28.3% / 35.0% / 36.7%. In neither subgroup is the oldest tertile over-represented; in both, the point estimate sits very slightly below 33.3%.
6. How this compares to prior research
The empirical literature on RAE in CEO selection is genuinely split, and our results land on the more recent side of that split.
Du, Gao and Levi (2012, Economics Letters) analysed 375 S&P 500 CEOs and reported a deficit of summer-born executives, consistent with the youngest-in-class being penalised. Their paper is the most-cited source for the popular claim that “CEOs are disproportionately born in the autumn.”
Pegah and Bigus (2024) revisited the question with a substantially larger S&P 1500 sample and more carefully reconstructed state-level cutoff dates. Their conclusion: “We find no support for the existence of the relative-age effect for CEOs either by season of birth or relative age in months. On the whole, the distribution of CEO birth dates is similar to the US population.” Our findings, drawn from a different population and using national rather than state-level cutoffs, are consistent with theirs.
There are at least three plausible reasons why the RAE that is so robust in school-age leadership measures does not appear at the CEO level:
• Selection at the very top of the distribution is dominated by other variables. Becoming a FTSE 100 or Fortune 100 CEO is a rare event with strong selection on opportunity, sector, board chemistry, and luck. The marginal advantage from relative age — a few percentage points in primary-school confidence — may simply be drowned out.
• The relative-age advantage decays with time. A robust finding in the education literature is that the head start fades through secondary school and reverses at university entry — older students lag younger ones in higher-education performance. By the time the cohort is in its forties and fifties, the original maturity gap should have been long since absorbed.
• Compositional washout. The largest national subgroups in our sample (UK and US) account for 66% of analysed CEOs. The remaining 34% span 22 other countries with seven different academic-year cutoffs. Even if RAE were operating in some national systems, mixing CEOs from systems with January, April, and September cutoffs reduces the chance of any signal surviving aggregation.
7. Limitations and gaps
A robust analysis is honest about what it cannot see.
Sample size
163 CEOs is a respectable number, but it is not large by RAE-research standards. Original sport-and-school RAE studies use samples of thousands, sometimes hundreds of thousands. A subtle effect of, say, a 5-percentage-point over-representation of the oldest tertile would require roughly 600 CEOs to detect with 80% statistical power. We can rule out a large effect; we cannot rule out a small one.
Missingness in the Fortune 100
Fortune 100 CEOs in the analysed sample (n=67) under-represent the index by 33%. Specifically, 33 Fortune 100 CEOs are excluded because we could verify only their birth year, not month. This missingness is unlikely to be random: it correlates with how publicly profiled an executive is. CEOs of certain insurers, mutual companies, and family-controlled firms are more likely to keep precise birth dates private. If those private-profile CEOs differed systematically from public-profile CEOs in their birth-month distribution, the Fortune 100 result would be biased — though there is no obvious mechanism by which they should.
Single-cutoff assumption
We assume one cutoff date per country. This is a simplification, especially for the United States. US states use different kindergarten cutoffs ranging from June 1 to January 1; September 1 is the modal but not the only choice. We use September–August as the US default, which is the academic-year framing most US-educated CEOs would have experienced, but a state-precise analysis would categorise some CEOs differently. Pegah and Bigus (2024), who did the state-level work for the US, also found no RAE — so we have moderate confidence the simplification is not driving the null.
Country-of-education classification
For CEOs who moved between countries during their schooling, we coded the country of primary and secondary education on best-available evidence. Edge cases exist (e.g. dual-national executives who attended international schools) and have been coded by best judgement.
Sector and gender effects not modelled
We did not adjust for sector or gender in the main analysis. Both could in principle interact with birth seasonality. Sample sizes within sector are too small for stable estimation; the gender split (about 12% female) is consistent across tertiles.
Survivorship and timing
The sample reflects who is currently CEO of a FTSE 100 or Fortune 100 company at a single point in time. Recent appointments mean some “year only” Fortune 100 CEOs may publish more precise dates over time; the dataset records 39 CEOs as having been appointed within the last few years.
8. What this means
The relative age effect is one of the most carefully documented phenomena in developmental and educational psychology. It is real in primary-school classrooms, real in junior sport, and real in academic test scores at age 16. None of that is in question here.
What our analysis suggests is that the effect does not visibly survive the long, noisy, lottery-like funnel that produces the chief executives of the world’s largest listed companies. By the time someone is being considered for a FTSE 100 or Fortune 100 chair, the September-vs-August edge that mattered at age six has been completely overtaken by university choice, professional speciality, deal flow, sector cyclicality, network effects, scandals, and luck. If anything, the dataset hints — without statistical confidence — that summer-born executives are slightly over-represented in the youngest third, exactly the group RAE would predict to be under-represented.
For practitioners, three takeaways:
• There is no obvious birth-date “advantage” in CEO selection at the top of the FTSE or Fortune. You can stop telling the August-born child they have a glass ceiling at the very top of corporate life. We can’t see one in the data.
• Apparent calendar-month patterns require a baseline check. The FTSE’s March and September spikes look striking until you remember that the underlying UK population shows the same peaks. Birth seasonality is a real demographic phenomenon and a frequent confound in any month-of-birth analysis.
• The contrast with sport is informative. In professional ice hockey, football, and rugby, the RAE persists into adulthood because the selection system that produced it (age-graded competition, early talent identification, cumulative coaching investment) continues into professional careers. The C-suite has no equivalent. There is no FTSE 100 youth academy. CEO selection is messier, more idiosyncratic, and apparently more forgiving of when you happened to be born.
Sources and further reading
• Du, Q., Gao, H., & Levi, M.D. (2012). The relative-age effect and career success: Evidence from corporate CEOs. Economics Letters, 117(3), 660–662.
• Pegah, B., & Bigus, J. (2024). Reexamining the relative-age effect for CEOs in the S&P 1500. (Accessed via Emerald Insight, 2024.)
• Dhuey, E., & Lipscomb, S. (2008). What makes a leader? Relative age and high school leadership. Economics of Education Review, 27(2), 173–183.
• Kuhn, P., & Weinberger, C. (2005). Leadership skills and wages. Journal of Labor Economics, 23(3), 395–436.
• Office for National Statistics. Births in England and Wales: summary tables (used for UK seasonal-baseline reasoning).
• Hearn, T.J., & Whitmore, D. (2025). An abrupt mid-1970s shift in UK birth seasonality. Journal of Biological Rhythms (background for the March/September seasonal interpretation).
• Gladwell, M. (2008). Outliers: The Story of Success (popularised RAE).
A note on data
Birth months were drawn from a combination of UK Companies House director filings, Wikipedia (cross-referenced where possible), corporate biographies, news coverage, and SEC filings. Where a month could not be verified to satisfactory standard the CEO was excluded rather than estimated. Of the five FTSE 100 constituents that are investment trusts (each lists a fund manager rather than a conventional CEO), four are excluded on missing-birth-month grounds; the fifth, Pershing Square Holdings, is retained because Bill Ackman is widely identified as the principal CEO. The full dataset is available alongside this article.
Interestingly the REA in sports inverts when you get to elite levels. 45% of players in EPL academies were born Sep-Nov, compared to 10% June-August. Yet in the actual EPL it was newly 50/50 between H1/H2 (2019 data).
Recent data following Spanish academy players show that although over represented in academies, early born players disproportionately fail to make it. Late maturers reached professional football 30.8% of the time vs 5.6% for early maturers.
This is coined the underdog effect. Lower physical benefits force super adaptive cognitive skills. Meaning if they can survive and catch up physically over time, they also out develop more physically mature peers cognitively.